HYPERTROPHIC
OLIVARY
DEGENERATION (HOD), REVISITED
DRS VIRZI
V.¹, TAMPIERI
D.², WEILL
A.³ AND
VENTURI
F.¹
MCGILL UNIVERSITY, MONTREAL, CANADA. ³DEPT. DE NEURORADIOLOGIE, UNIVERSITÉ DE MONTRÉAL, CANADA
We refer the reader to our article on this topic published in the April 2001 issue of our Newsletter, by Venturi F. et al. It was giving the description of the Guillain-Mollaret Triangle and showing an example of HOD on the same side as the involvement of the Central Tegmental Track (CTT) from the red nucleus down to the medullary olive.
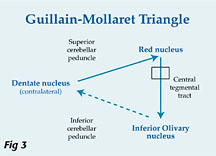
The Guillain-Mollaret triangle is a triangular circuit connecting the dentate nucleus of the cerebellum of one side with the red nucleus and the inferior olivary nucleus of the other side, via the superior cerebellar peduncle and the central tegmental tract (CTT) (Figs. 1, 2).
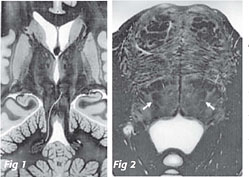 |
(Fig 1)
Anatomical oblique section along the superior cerebellar peduncles. The path of the cerebello-rubral tract from dentate nucleus to the contralateral red nucleus is shown. (Fig 2) Anatomical, axial section of the brainstem, at the level of the pons, showing the location of the central tegmental tracts. |
HOD is considered a
transsynaptic degeneration because it occurs following loss of neuronal
input to a cell, in this case the neurons of the inferior olivary nucleus.
HOD occurs when a lesion, usually a haemorrhage, causes an interruption of
the Guillain-Mollaret triangle (Fig3). |
|
|
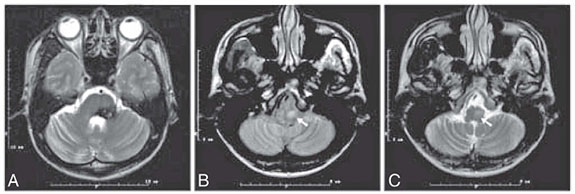
If the lesion is located in the tegmentum of the brainstem and involves the CTT, the degeneration occurs to the ipsilateral olive. Fig4 (below) MR images obtained in a patient with brainstem cavernous angioma. (A) Axial T2-weighted image shows hyposignal suggesting hemosiderin deposits in the left tegmentum of the pons. (B,C) axial PD/T2- weighted images show hypersignal at the level of the left medullary olive which appears also enlarged in comparison to the right one. The signal change is more apparent on the PD-weighted image (B). |
|
|
|
||
7